Covid increases annual mortality … to previously common rate
The year 2020 is behind us for some time and we finally have the data for the whole first calendar year of Covid. I would like to use data from the USA here, partly because it is a major country and partly because the data is the most easily available. Even so, it was a problem to find the data. Indeed, only the last few years without a historical context are reported everywhere.
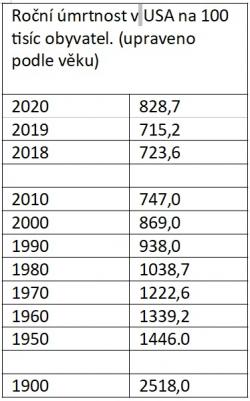
And it turns out that in 2020 the mortality rate in the USA was higher than in recent years. But before 2000, mortality in the United States was higher every year, even without epidemics. According to the State Institute Centers for Disease Control and Prevention.
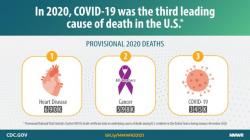
In the US, COVID-19 was the third leading cause of death in 2020 after heart disease and cancer. (See Ahmad et al. 2020). Credit: CDC.
In By 2020, 828.7 people per hundred thousand people had died in the United States. Due to the epidemic, it was more than a year earlier. In 2019, only 715.2 people per hundred thousand people died in the United States. This is a significant year-on-year jump.
However, a generation earlier, even higher numbers were common. In 2000, there were 869 people per hundred thousand inhabitants. And for example in 1970 it was 1222.6 people per hundred thousand inhabitants. These are conversions according to individual age categories
Of course, it can be rightly argued that without lockdowns and drapes and other measures, mortality would be higher. Hard to say by how much. Overall, 1% of those infected die from COVID (ie 10 times more than with normal flu), in risk groups it is even around 10%. An optimist would say that the survival rate of those infected is 90-99 percent. And that it is therefore useless to declare a state of emergency and panic because of the mortality rate that was normal twenty years ago. But a pessimist could rightly argue that if a lot of people become infected, then even a mere percentage of a lot of people can be very many people. And maybe it can be you. I will leave such an assessment to the kind reader.
Sources:
Centers for Disease Control and Prevention. (data.cdc.gov). National Center for Health Statistics. Data visualization – Death rates and life expectancy at birth. Age adjusted, both sexes. link ) (until 2018)
Ahmad FB, Cisewski JA, Miniño A, Anderson RN. Provisional Mortality Data – United States, 2020. MMWR Morb Mortal Wkly Rep 2021; 70: 519–522. DOI: http://dx.doi.org/10.15585/mmwr.mm7014e1 . link ) Released April 9, 2021. Age adjusted.
Note
These statistics are divided according to age groups, otherwise it could be wrong to look like that in a municipality where many pensioners live, the health situation is mysteriously worsened compared to the rest of the state. While in fact there are more deaths just because there are a lot of seniors living there.
Note: This article have been indexed to our site. We do not claim legitimacy, ownership or copyright of any of the content above. To see the article at original source Click Here


